Este artículo está disponible sólo en inglés.
After a turbulent first quarter, the second quarter brought one of the largest volatility spikes on record, swiftly followed by one of the fastest reversals in market history. In early April, U.S. equity markets experienced multiple days of 5% selloffs, pushing the CBOE VIX Index to levels last seen during the global financial crisis and the early days of the COVID-19 pandemic. However, amid these significant declines, U.S. equities had their third-best trading day since 1980, gaining nearly 10% on April 9. This positive momentum continued throughout the quarter, leading to a new bull market as equities rebounded more than 20% from their April lows and reached a new all-time high on June 27.
Throughout the years, we have consistently highlighted that volatility tends to cluster, with large positive and negative market days often occurring in close succession. Historically, we have shown that there has been a 2% chance of a plus or minus 3% day in the market. However, once such a day occurs, there is an 80% chance that another move of that magnitude will occur in the subsequent 30 days. As a result, reacting to these significant days can undermine clients' investment goals and objectives.
Figure 1 illustrates major asset class returns during the first quarter, the second quarter, and year-to-date, through June 24.
Figure 1: Major asset class returns
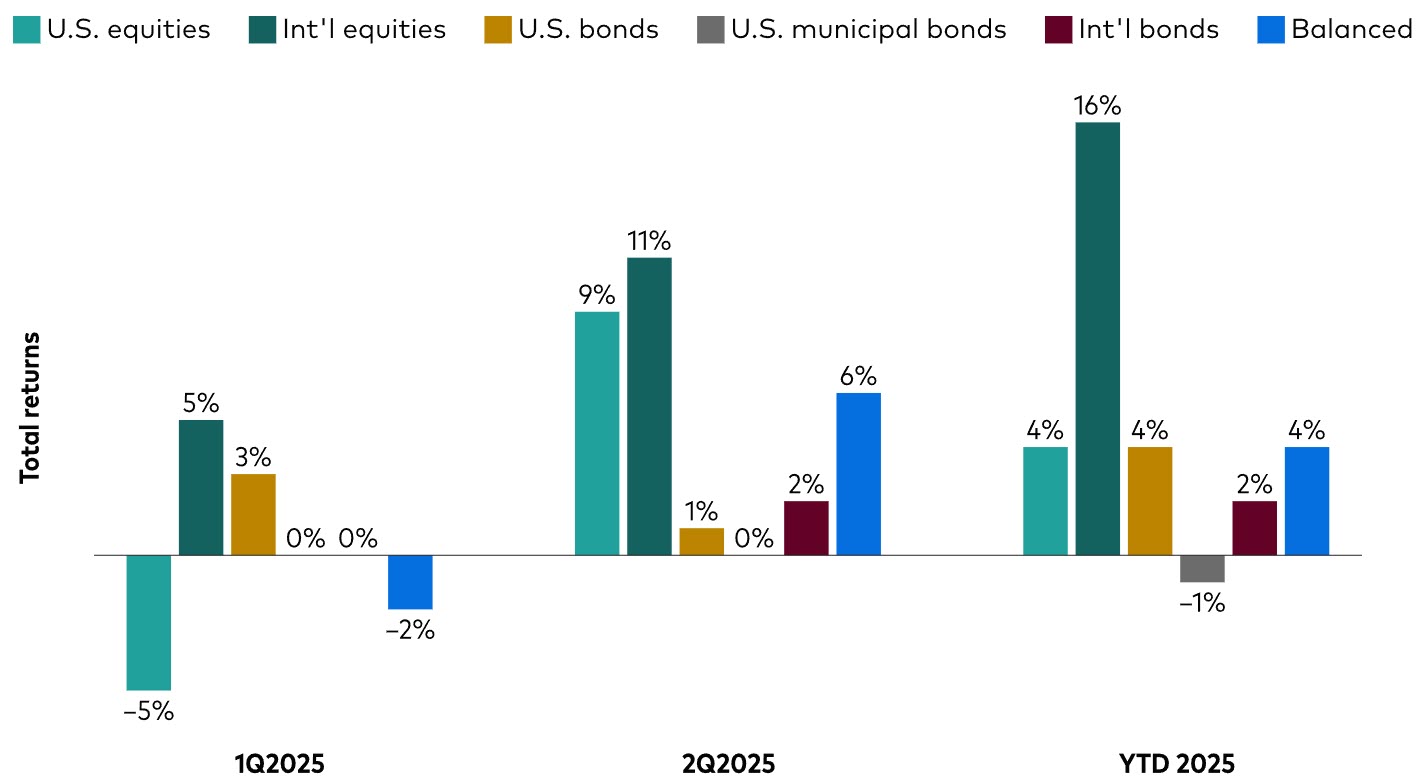
Source: Vanguard Investment Advisory Research Center using data as of June 24, 2025.
Notes: U.S. equities are represented by CRSP US Total Market Index, international equities by FTSE Global All Cap ex US Index, U.S. bonds by the Bloomberg U.S. Aggregate Bond Index, international bonds by the Bloomberg Global Aggregate ex-USD Index Hedged Index, balanced by a mix of 60% CRSP US Total Market Index and 40% Bloomberg U.S. Aggregate Float Adjusted Index, and municipal bonds by the Bloomberg Municipal Bond Index.
Past performance is not a guarantee of future returns. The performance of an index is not an exact representation of any particular investment, as you cannot invest directly in an index.
The first four months of 2025 were undoubtedly challenging for investors, marked by significant equity drawdowns and a relentless news cycle. This period of volatility, combined with the multiple pullbacks experienced over the past five years, has tested the resilience of your clients. These pullbacks began with the onset of the COVID-19 pandemic in 2020, followed by the inflation spike in 2022, which coincided with sell-offs in both equity and fixed income markets. The community banking crisis in early 2023 added another layer of uncertainty.
Despite these challenges, financial advisors played a crucial role in coaching their clients to stay the course, maintain their asset allocations, and adhere to their investment plans. Over the past five years, those who remained steadfast throughout the market’s various ups and downs realized strong returns. See Figure 2 for details.
Figure 2: Year-to-date and annualized returns over the past 10 years (as of June 24)
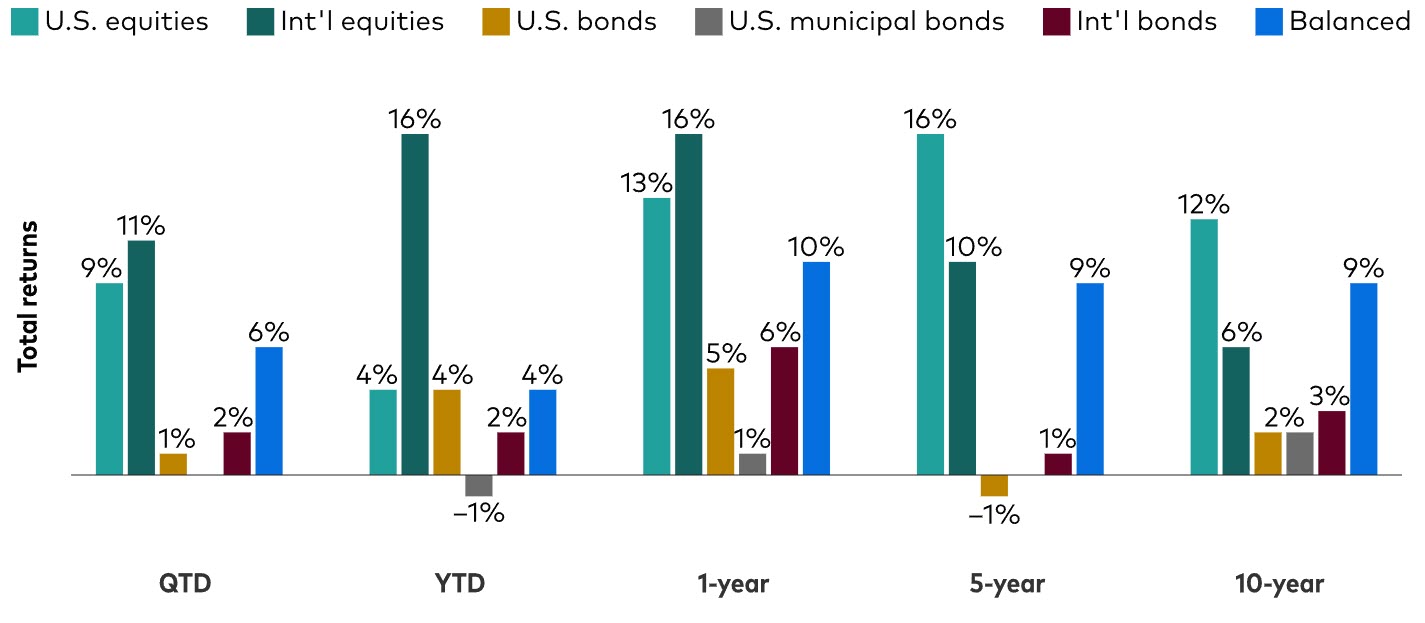
Source: Vanguard Investment Advisory Research Center using data as of June 24, 2025
Notes: U.S. equities are represented by CRSP US Total Market Index, international equities by FTSE Global All Cap ex US Index, U.S. bonds by the Bloomberg U.S. Aggregate Bond Index, international bonds by the Bloomberg Global Aggregate ex-USD Index Hedged Index, balanced by a mix of 60% CRSP US Total Market Index and 40% Bloomberg U.S. Aggregate Float Adjusted Index, and municipal bonds by Bloomberg Municipal Bond Index.
Past performance is not a guarantee of future returns. The performance of an index is not an exact representation of any particular investment, as you cannot invest directly in an index.
As we noted last quarter, as well as in many commentaries throughout the years, volatility is an inevitable aspect of long-term investing. It is the primary reason risk premiums exist. And it is why advisors factor drawdowns into the assumptions when setting and revisiting client asset allocations. We refer to periods like those we've seen in 2025 as “Advisor's Alpha® weather” because they are critical moments that matter for advisors to provide essential guidance to their clients.
Your clients were likely bombarded with headlines urging them to make changes to their portfolios. As an advisor, a crucial aspect of the value you provide is your ability to help your clients navigate these headlines and stay the course, even when emotions and media noise tempt them otherwise.
2025 tells the same story
You may have received calls from clients in early April after several consecutive 5% down days. By staying calm and resisting the urge to move to cash—even for a short period—you had a significant positive impact on their returns.
Figure 3 illustrates three outcomes:
Staying the course. The year-to-date performance of a balanced portfolio of U.S. stocks and bonds.
Leaving the market. The consequences of moving to cash on April 8 and staying in cash through June 24.
Bouncing in and out of the market. The consequences of moving to cash on April 8 and reinvesting back into the market a week later.
Within just a few months, an investor who stayed the course is already 5% better off than one who exited the market for a week—and nearly 10% better off than one who remained in cash through June 24.
Figure 3: Advisor’s Alpha behavioral coaching—the opportunity to improve client outcomes

Source: Vanguard Investment Advisory Research Center using data as of June 24, 2025.
Notes: Balanced portfolio is represented by a mix of 60% CRSP US Total Market Index and 40% Bloomberg U.S. Aggregate Float Adjusted Bond Index. Cash by the FTSE 3 Month T-Bill Index.
Past performance is not a guarantee of future returns. The performance of an index is not an exact representation of any particular investment, as you cannot invest directly in an index. This hypothetical illustration does not represent the return on any particular investment and the rate is not guaranteed.
Vanguard’s 3B mental model explains the natural impulse to act
We believe the impulse to act is deeply rooted in human nature. To help clients understand this, we developed the 3B mental model, Figure 4. Educating clients about this model can significantly reduce their stress during uncertain market periods. Moreover, advisors who incorporate these principles not only build stronger relationships but also enhance long-term investment outcomes for their clients and their practice.
Figure 4: Vanguard’s 3B mental model—understanding client behavior
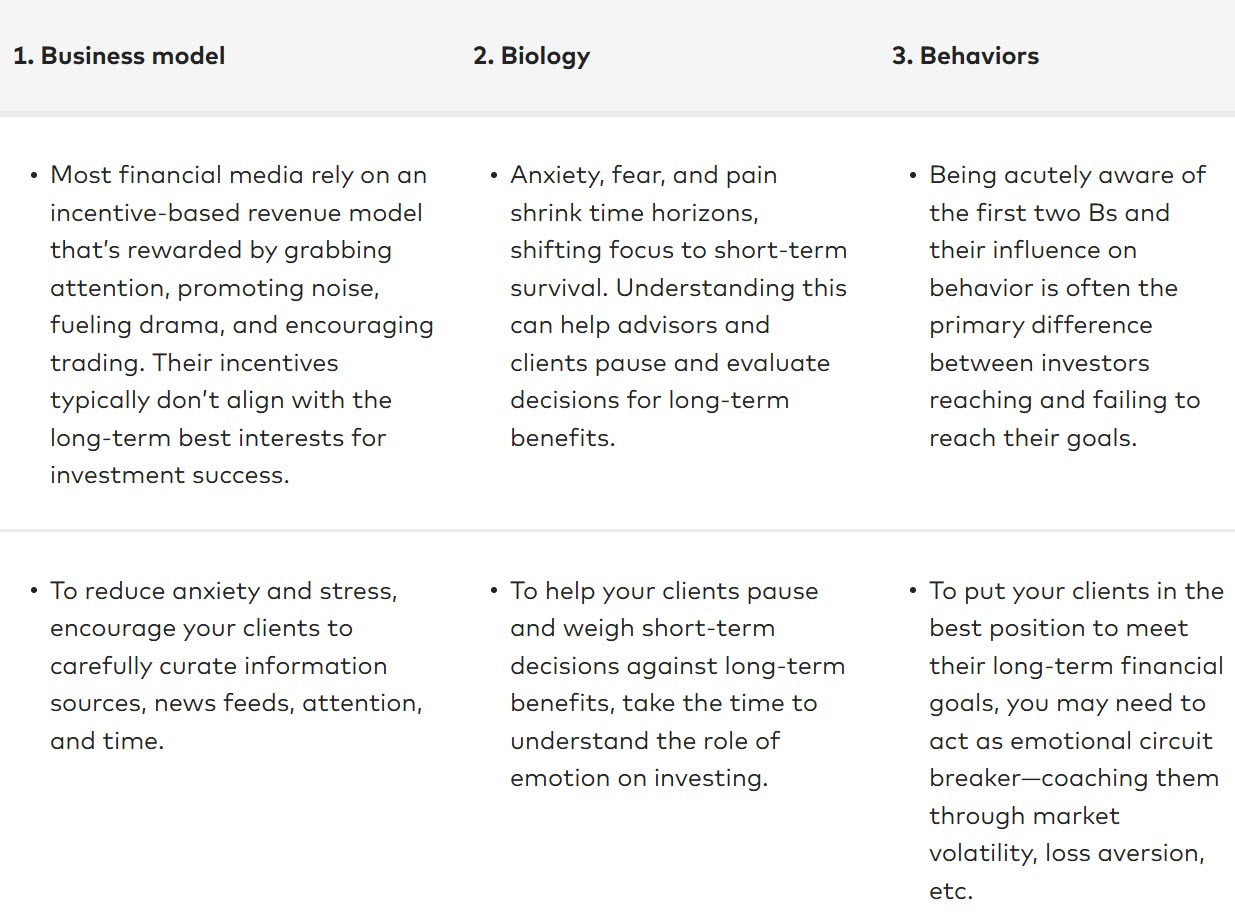
Source: Vanguard Investment Advisory Research Center.
Navigating clients through the noise
Vanguard’s guide to behavioral coaching can complement the 3B mental model, helping you guide clients through inevitable market volatility. As we noted last quarter, stocks have traded in correction territory 30% of all trading days since 1980. Over the past 45 years, we have experienced 15 corrections, including the one that began in March of this year. As illustrated in Figure 5, each correction varies in both the extent of the decline and the time it takes to recover.
Figure 5: Max drawdown and time to recovery for each correction since 1980
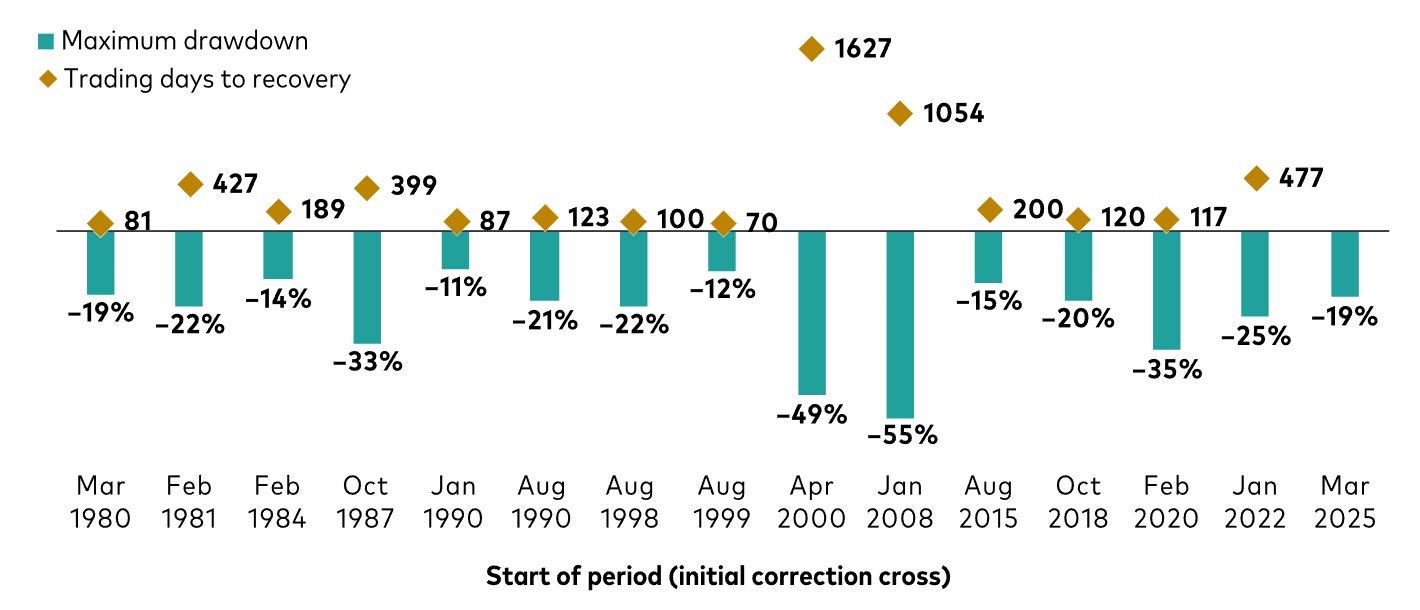
Source: Vanguard Investment Advisory Research Center using data as of June 24, 2025.
Notes: Equities represented by the Wilshire 5000 Index from 1980 through April 22, 2005; the MSCI US Broad Market Index from April 23, 2005, through June 2, 2013; and the CRSP US Total Market Index thereafter. We calculated the max drawdown for each time equities reached correction territory (i.e., 10% decline from previous market high). Additionally, we counted the number of trading days until a new market high was achieved. We repeated this process starting March 1980.
Past performance is not a guarantee of future returns. The performance of an index is not an exact representation of any particular investment, as you cannot invest directly in an index.
Staying the course does NOT mean “buy and hold” or “set it and forget it”
"Stay the course" isn’t a passive "set it and forget it" or "buy and hold" strategy. It’s an active framework—an ongoing partnership with clients and their investment goals in which each interaction deepens the relationship and builds trust. Clients' reactions to market volatility and headlines, especially during bull and bear market cycles, provide valuable insights into their "real" risk tolerance for advisors. These insights may indicate a need to adjust the asset allocation initially determined during onboarding. Similarly, major life events, such as winning the lottery, having a child, losing a spouse, or receiving a large inheritance, can also prompt changes to a client's objectives, goals, and risk tolerance.
One of the most valuable components of the Advisors’ Alpha framework is helping clients stay the course during market drawdowns, amid fear of missing out (FOMO) and in the face of sensationalized headlines. Guiding clients through these challenging moments and focusing on what you can control is a uniquely human aspect of your offer. Through our extensive experience working with millions of clients, we have identified five key factors that can help clients navigate market volatility:
- Communicate proactively. Reach out to your clients—they likely want more communication during times of market stress.
- Lead with empathy. Meet clients where they are emotionally and share your own experiences with similar market challenges.
- Educate clients on risk premiums. Explain why they exist and how you chose their asset allocations with potential drawdowns in mind, such as those we've seen this year.
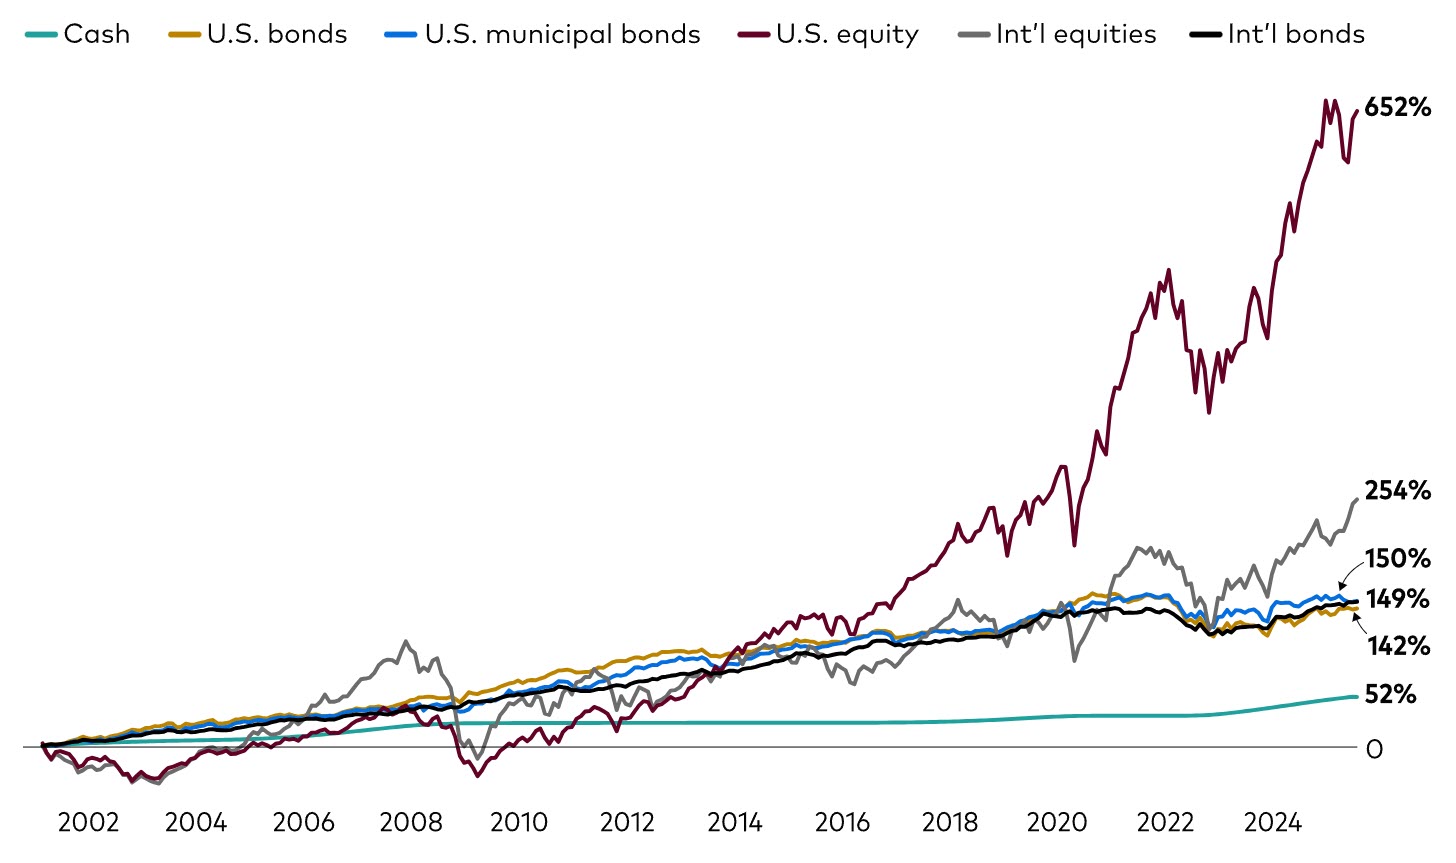
- Focus on long-term goals. Remind clients that achieving their long-term investment goals requires maintaining exposure to risk assets. Figure 6 shows the long-term returns of various major asset classes.
- Pulse check regularly. Use each interaction to continually gauge whether the client’s risk tolerance and asset allocation remain appropriate for their current circumstances.
Figure 6: Cumulative returns since 2001 for major asset classes
Source: Vanguard Investment Advisory Research Center using data as of June 24, 2025.
Notes: U.S. equities are represented by the Wilshire 5000 Index from 2001 through April 22, 2005; the MSCI US Broad Market Index from April 23, 2005, through June 2, 2013; and the CRSP US Total Market Index thereafter. International equities are represented by the Total International Composite Index through August 31, 2006; MSCI EAFE + Emerging Markets Index through December 15, 2010; MSCI ACWI ex USA IMI Index through June 2, 2013; and FTSE Global All Cap ex US Index thereafter, U.S. bonds are represented by the Bloomberg U.S. Aggregate Bond Index, international bonds by the Bloomberg Global Aggregate ex-USD Index Hedged Index, cash by the FTSE 3-Month T-Bill Index, and municipal bonds by the Bloomberg Municipal Bond Index.
Past performance is not a guarantee of future returns. The performance of an index is not an exact representation of any particular investment, as you cannot invest directly in an index.
Successfully navigating market volatility is good for your clients and your practice
Proactive communication with clients during tough times deepens their trust in you as their financial partner. Deeper trust not only strengthens your relationships but also can lead to more referrals and better business outcomes.
We’re here to support you and your clients in navigating Advisor’s Alpha weather—the inevitable volatility that accompanies a sound, long-term investment strategy.
For detailed information and resources, we encourage you to connect with your sales representative.
Important information
All investing is subject to risk, including possible loss of principal.
Diversification does not ensure a profit or protect against a loss.
Please remember that all investments involve some risk. Be aware that fluctuations in the financial markets and other factors may cause declines in the value of your account. There is no guarantee that any particular asset allocation or mix of funds will meet your investment objectives or provide you with a given level of income.
Past performance is not a guarantee of future returns. The performance of an index is not an exact representation of any particular investment, as you cannot invest directly in an index.
Bloomberg® and Bloomberg Indexes mentioned herein are service marks of Bloomberg Finance LP and its affiliates, including Bloomberg Index Services Limited (“BISL”), the administrator of the index (collectively, “Bloomberg”) and have been licensed for use for certain purposes by Vanguard. Bloomberg is not affiliated with Vanguard and Bloomberg does not approve, endorse, review, or recommend the Financial Products included in this document. Bloomberg does not guarantee the timeliness, accurateness or completeness of any data or information related to the Financial Products included in this document.
Vanguard Mexico is not responsible for and does not prepare, edit, or endorse the content, advertising, products, or other materials on or available from any website owned or operated by a third party that may be linked to this email/document via hyperlink. The fact that Vanguard Mexico has provided a link to a third party's website does not constitute an implicit or explicit endorsement, authorization, sponsorship, or affiliation by Vanguard with respect to such website, its content, its owners, providers, or services. You shall use any such third-party content at your own risk and Vanguard Mexico is not liable for any loss or damage that you may suffer by using third party websites or any content, advertising, products, or other materials in connection therewith.